Set up full stack observability
Set up log aggregation with Elastic and Scale out Prometheus with Victoria Metrics
Setting the Stage
If you're actually going to use this infrastructure in earnest, you'll need some form of monitoring and observability. Plural integrates directly with a number of observability providers, but the easiest and cheapest to get going quickly is to use our most streamlined setup, namely:
- Victoria Metrics - a scale-out, prometheus-compatible time series datastore, with a feature rich agent, vmagent. This gives you unified metrics observability
- ELK stack - handles log aggregation and search, and integrates directly with the Plural Console. It also doubles as a vector store if you wish to use some of our advanced AI functionality.
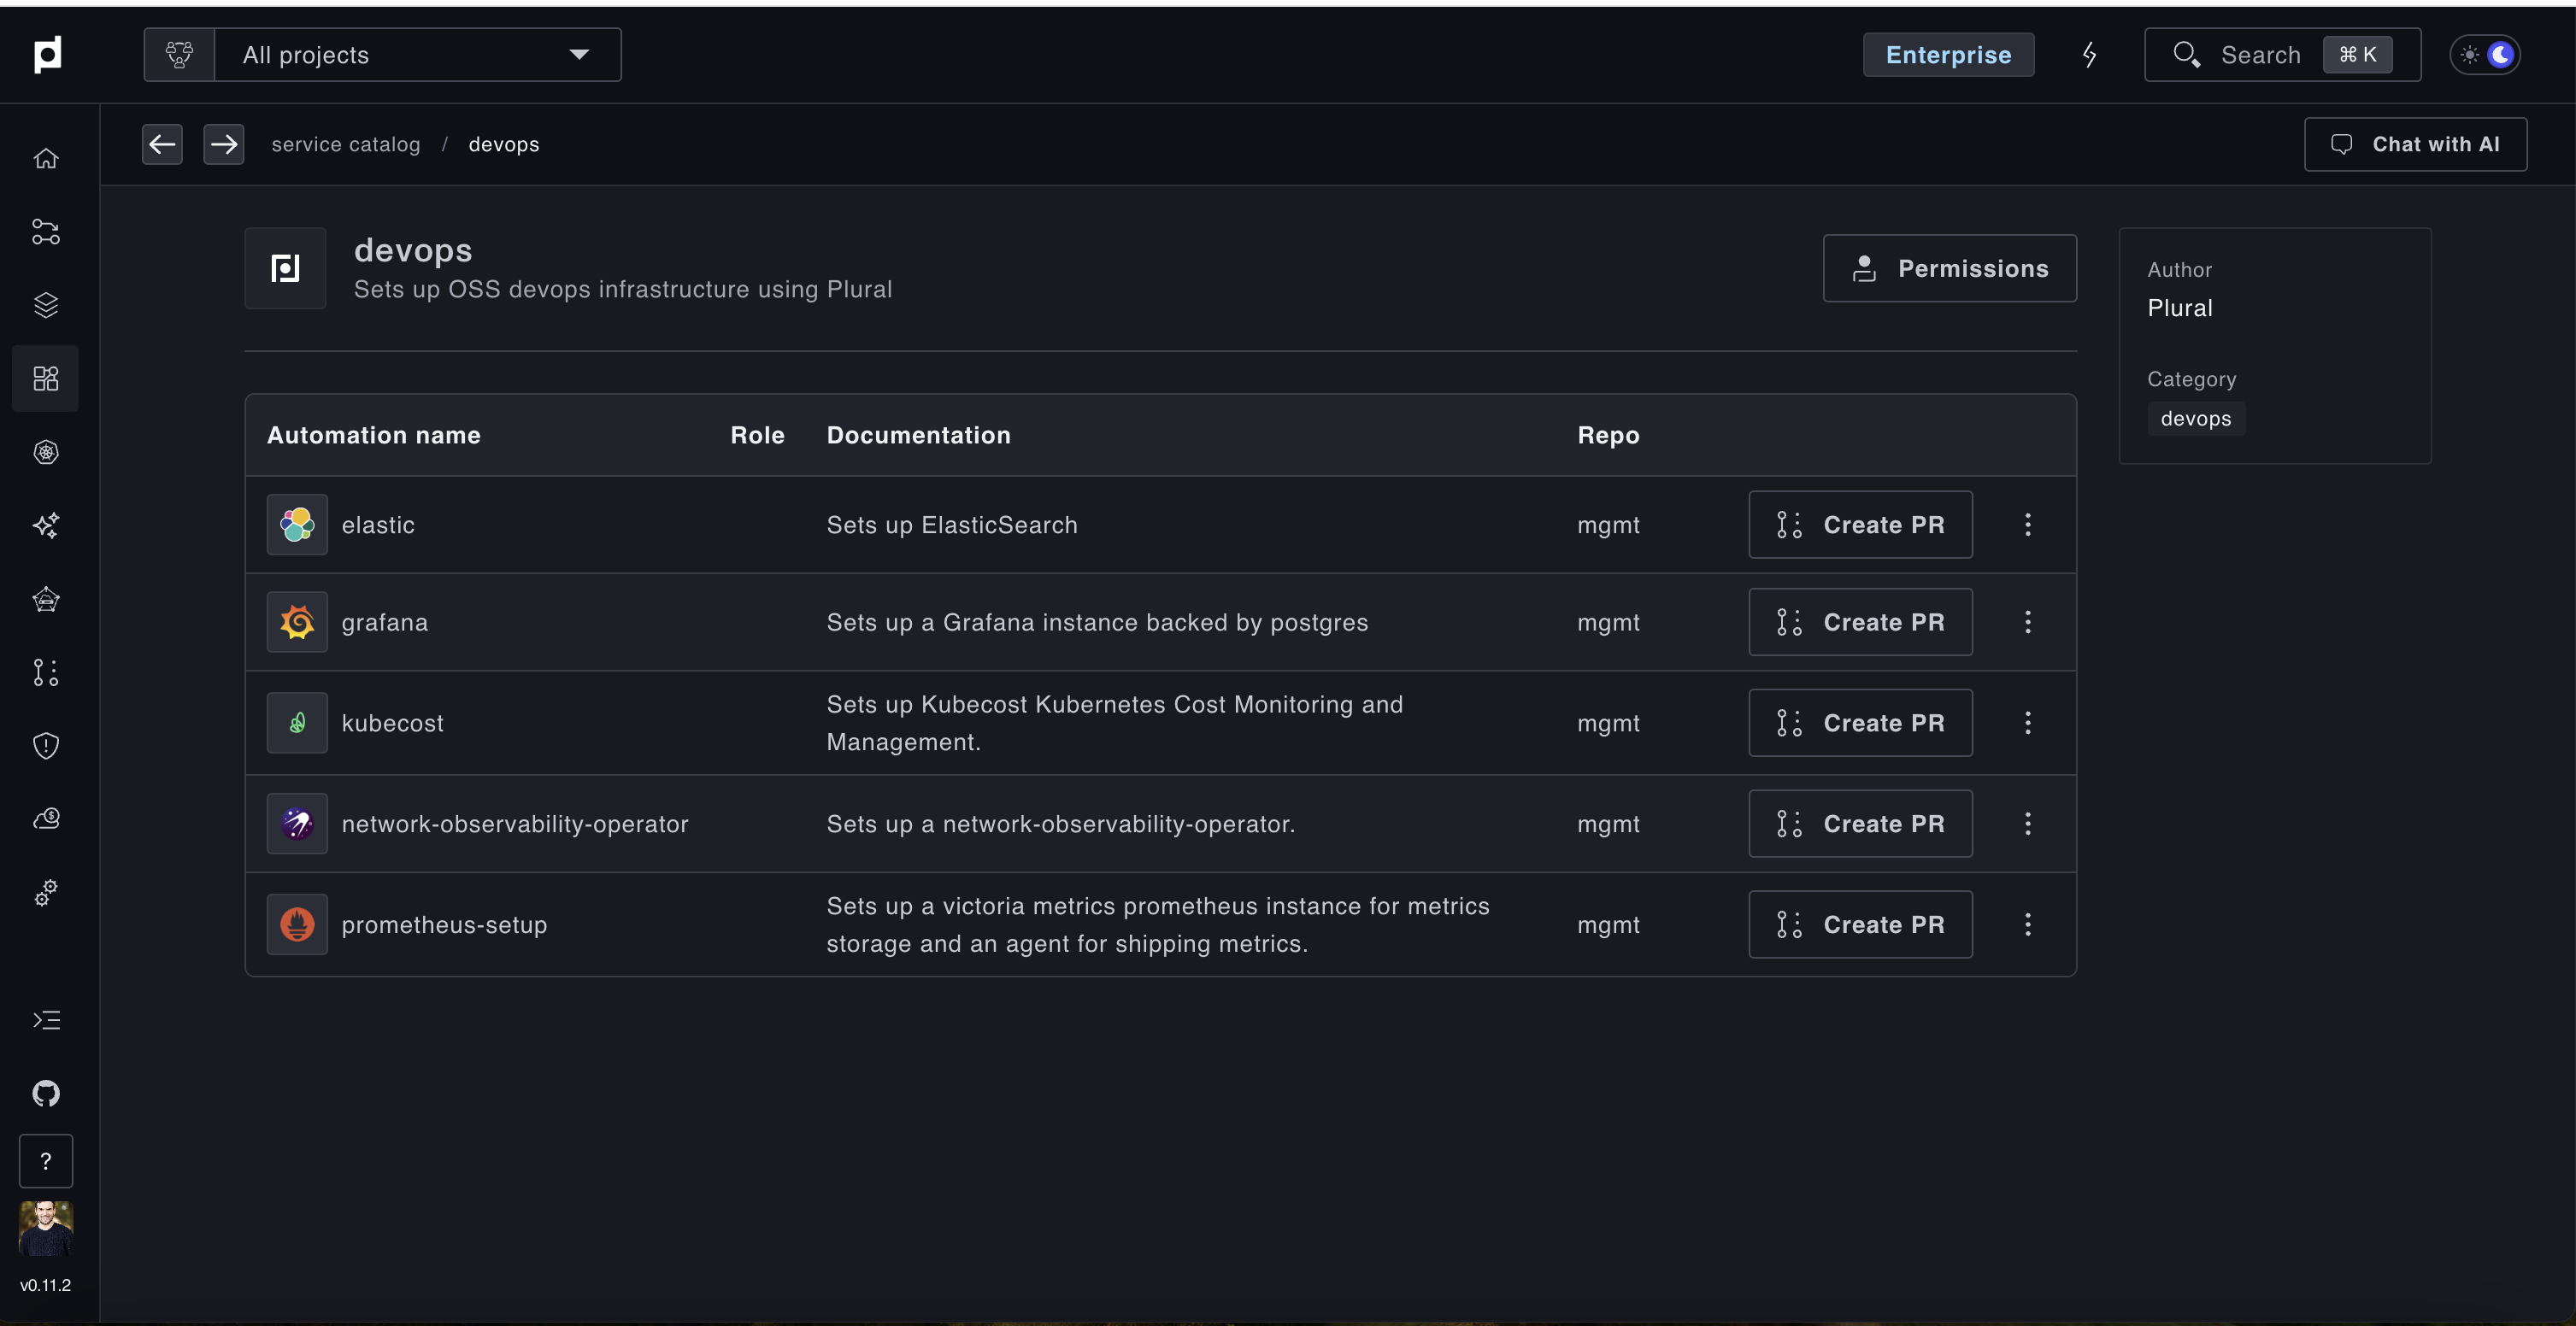
We already have a few streamlined setups in our service catalog to do this, you'll want to go to Catalogs -> devops (can do this with Cmd + K -> Catalog, or just use the sidebar), from there you should see a page like this:
Go through the wizards for both elastic and prometheus-setup. When they ask you to select a cluster, be sure to chose a cluster which has an actual load balancer and externaldns configured, as both expose a HTTP api that needs to be externally queried.
We recommend deploying both to the same cluster for ease of maintainence, your workload clusters will likely have everything, or you can configure the mgmt cluster to support load balancing as well and deploy them there.
Info:
For elasticsearch as well, we recommend using a decently large disk, between 100 - 200Gi as log data can be large. You can also resize these post-hoc and expand the number of replicas in your cluster. Most elasticsearch operations are managed entirely by the ECK kubernetes operator post-deploy.
What this configures and confirm its working
Both these PR automations will deploy in total:
- ElasticSearch Cluster - by default this will have three pods and whatever disk size you chose
- VictoriaMetrics Cluster - similar to ES
- VMAgent Global Service - deploys vmagent on all clusters managed by Plural, with auto-configuration to ship upstream to VictoriaMetrics
- Logstash Global Service - deploys filebeat + logstash on all clusters managed by Plural, with auto-configuration to ship to Elasticsearch using appropriately scoped permissions
You should be able to use the Plural Kubernetes Dashboard to see all the pods configured, and confirm they're shipping to the upstream. If they're failing, you'll see clear HTTP errors in the logs explaining they either cannot connect or have incorrect credentials.
Info:
Most errors here are going to be due to incorrect network setup, confirm the cluster you deployed to can actually create the necessary DNS records, that they resolve and that the load balancer is properly registered.
Plural AI can help resolve these issues as well.
You should also see your bootstrap/settings.yaml file has been modified to register the new Elasticsearch and Prometheus connections, it'll have data like below:
apiVersion: deployments.plural.sh/v1alpha1
kind: DeploymentSettings
metadata:
  name: global
  namespace: plrl-deploy-operator
spec:
  logging:
    driver: ELASTIC
    elastic:
      host: https://{your-elastic-fqdn}
      index: plrl-logs-*
      passwordSecretRef:
        key: password
        name: plrl-elastic-user
      user: plrl
    enabled: true

  prometheusConnection:
    host: https://{your-vmmetrics-fqdn}/select/0/prometheus
    passwordSecretRef:
      key: password
      name: basic-auth-prom
    user: plrl

  ai:
    vectorStore:
      enabled: true
      vectorStore: ELASTIC
      elastic:
        host: https://{your-elastic-fqdn}
        user: plrl
        index: plrl-ai-vectors
        passwordSecretRef:
          name: plrl-elastic-user
          key: password
This ensures the Plural Console can also query your newly created datastores, and the vector store integration enables our RAG workflows which can index incoming PRs, PagerDuty events, and other items for holistic AI root cause analysis of application failures.
Use Plural Metrics and Logging
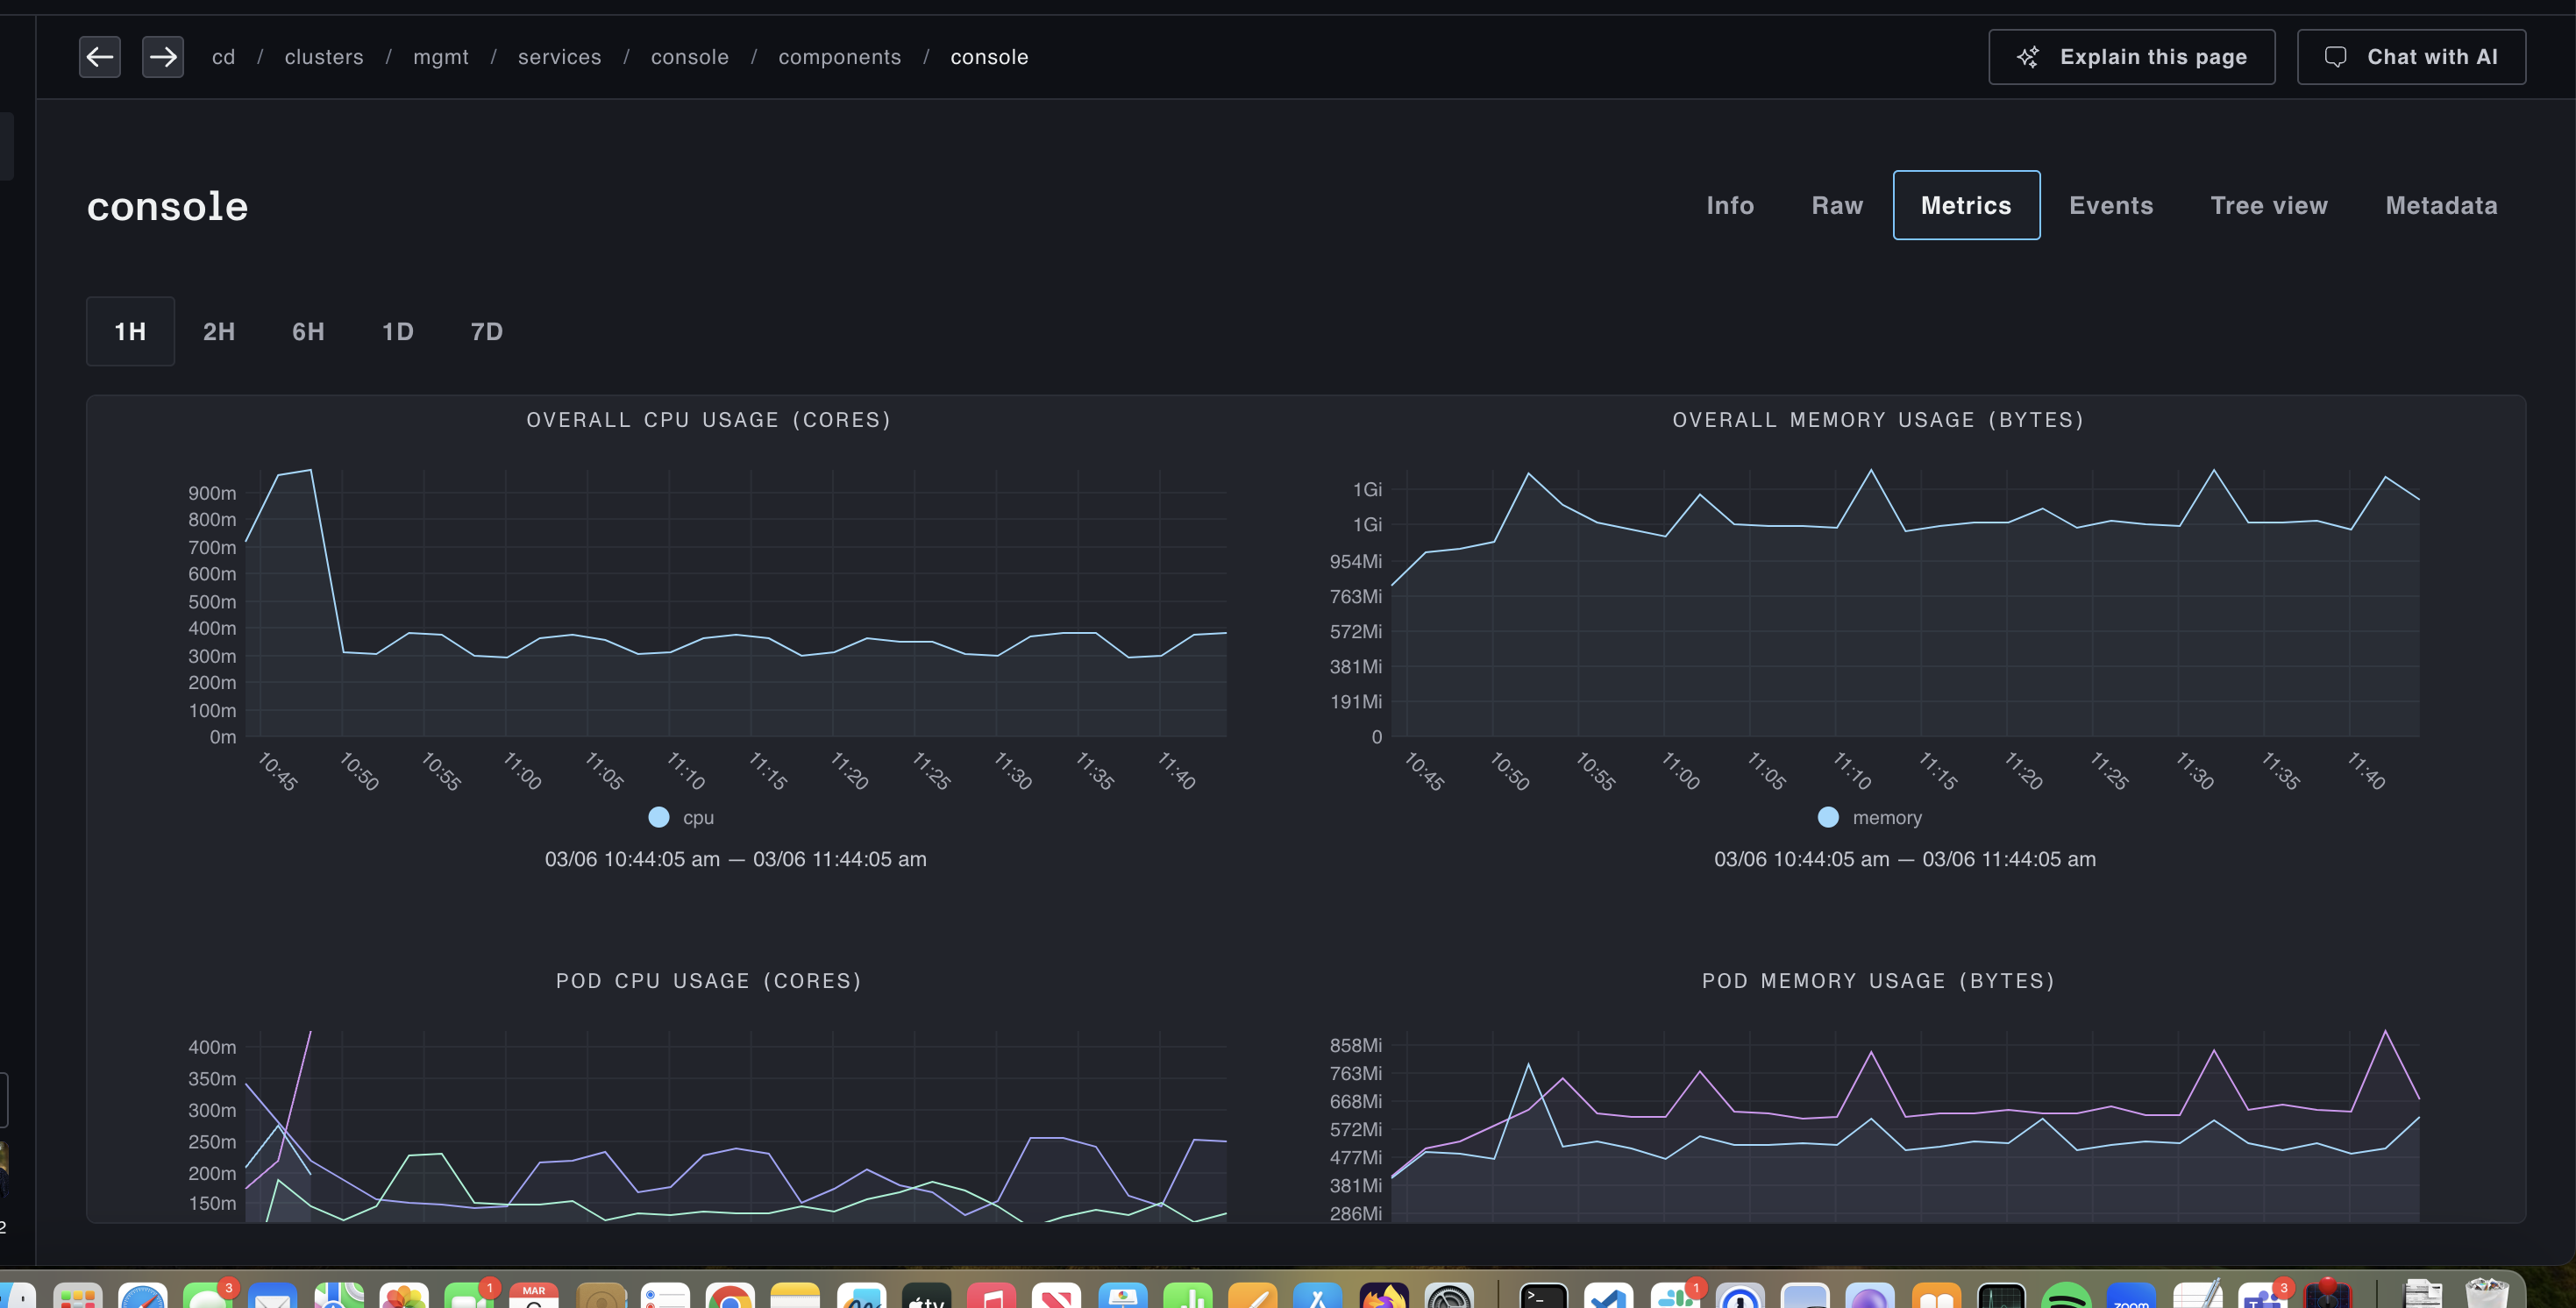
With everything, you should start seeing both metrics data and log aggregations in the Plural UI. To see metrics data, navigate to a deployment or statefulset component of a Plural Service, and you'll see a Metrics tab with graphs like:
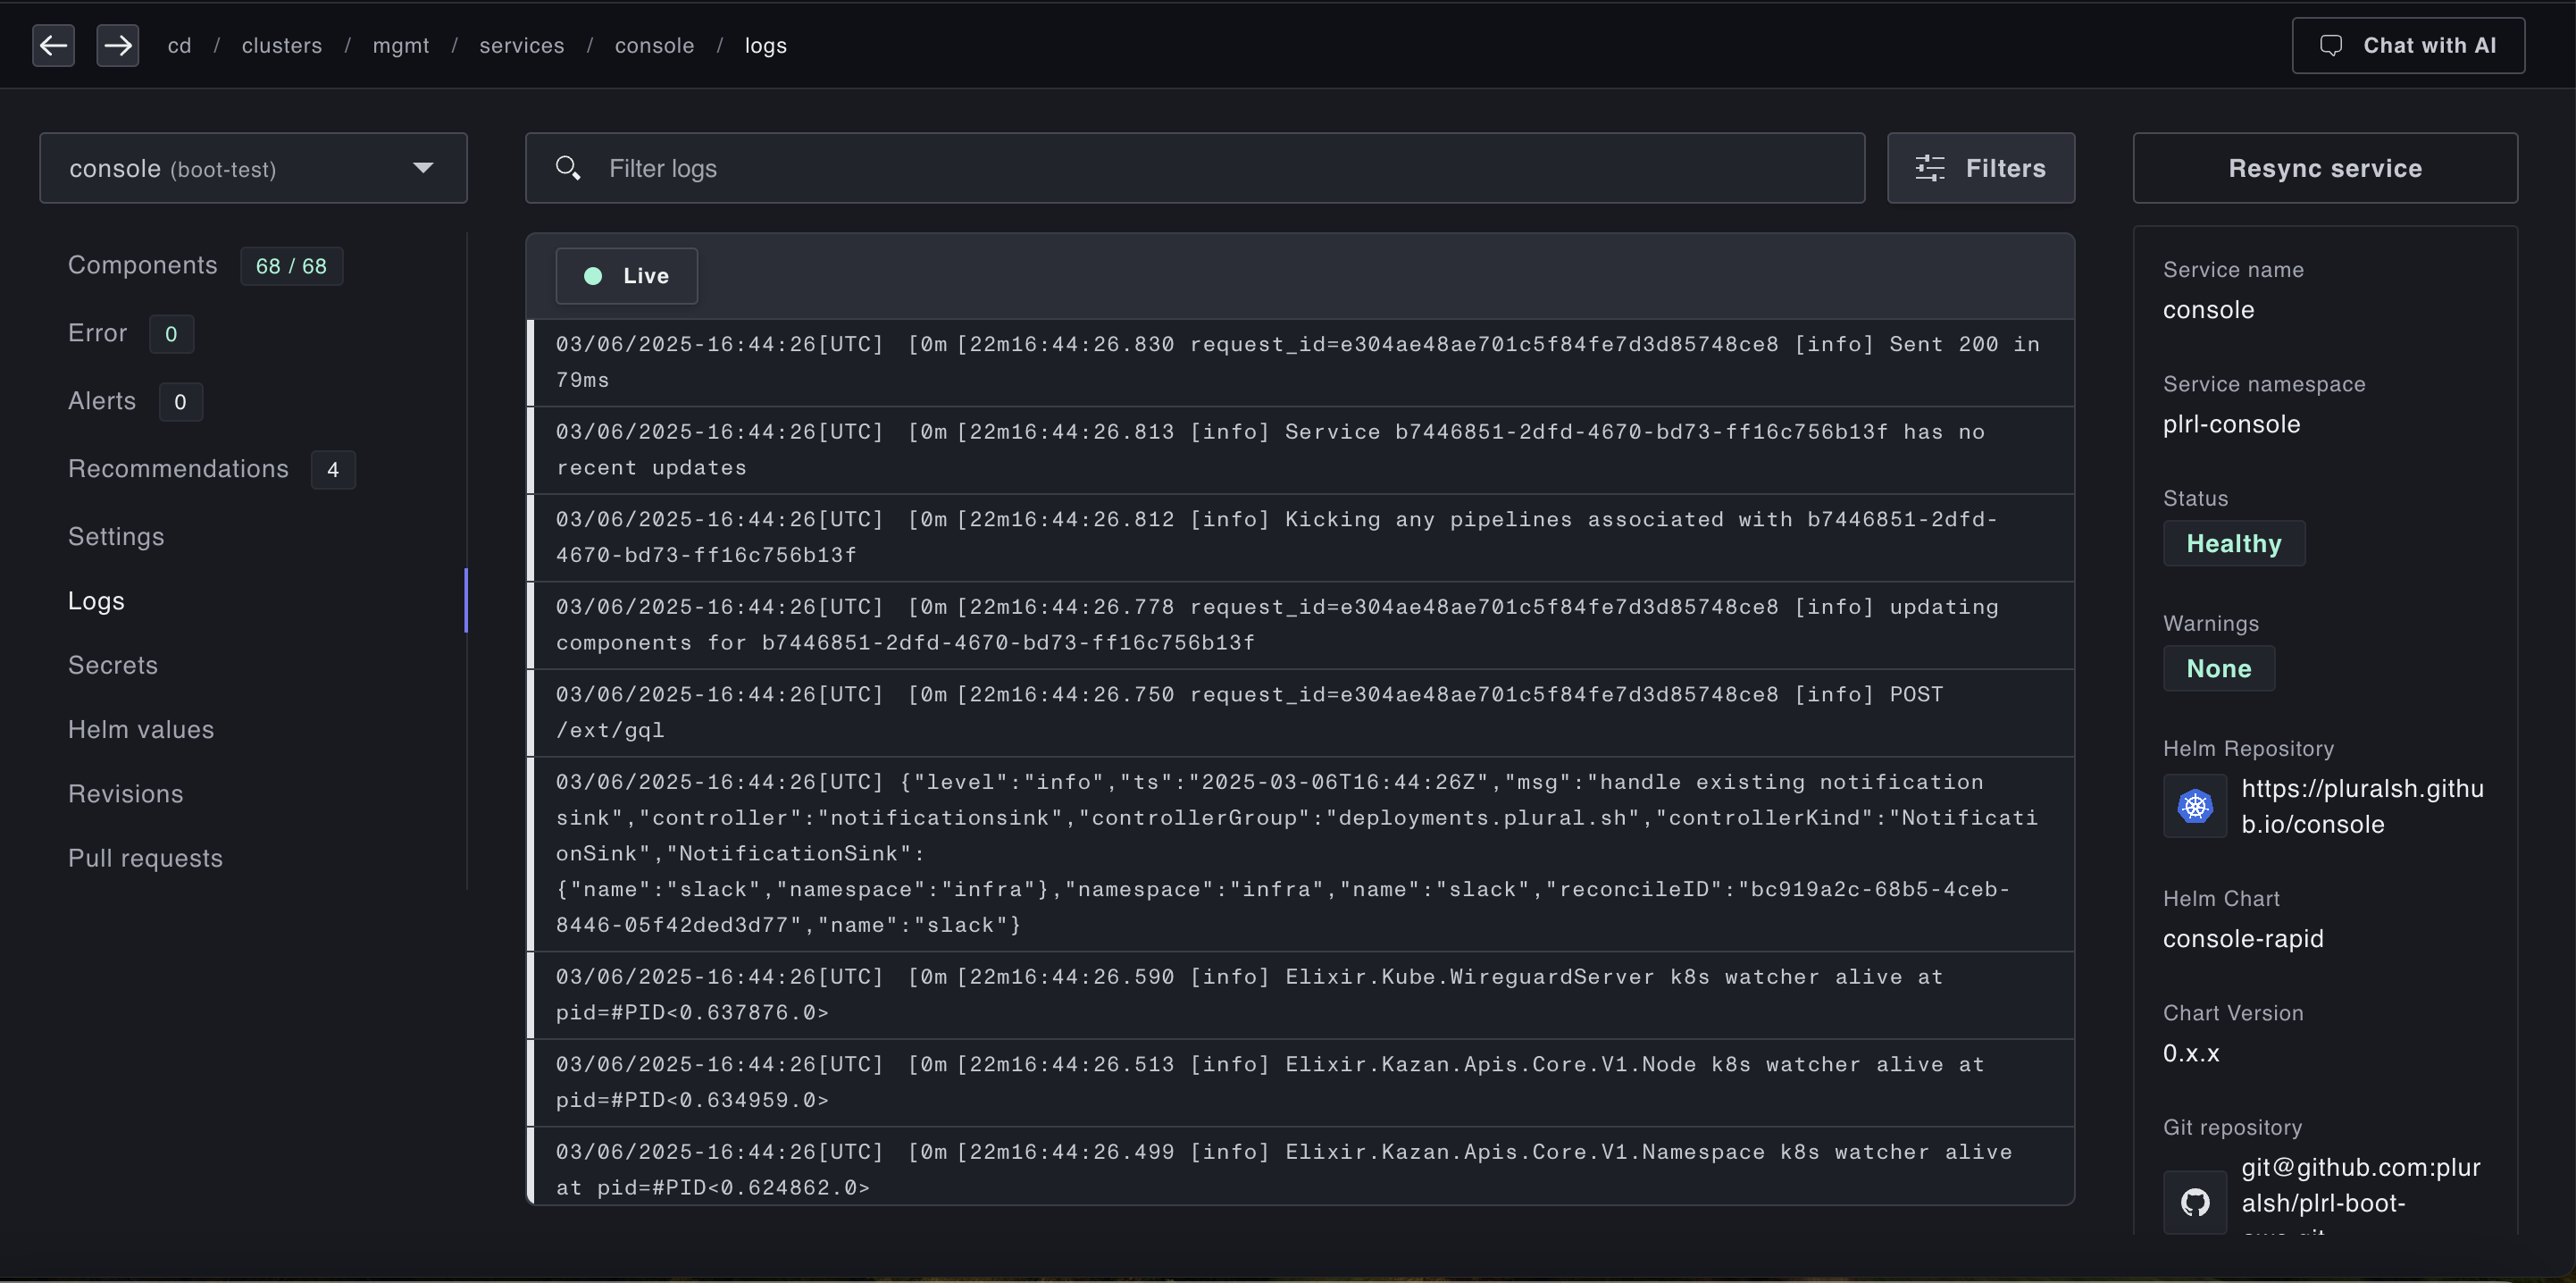
To see a log aggregation, either navigate to a cluster or to an individual service, and find the Logs tab, you'll see a log aggregation view like:
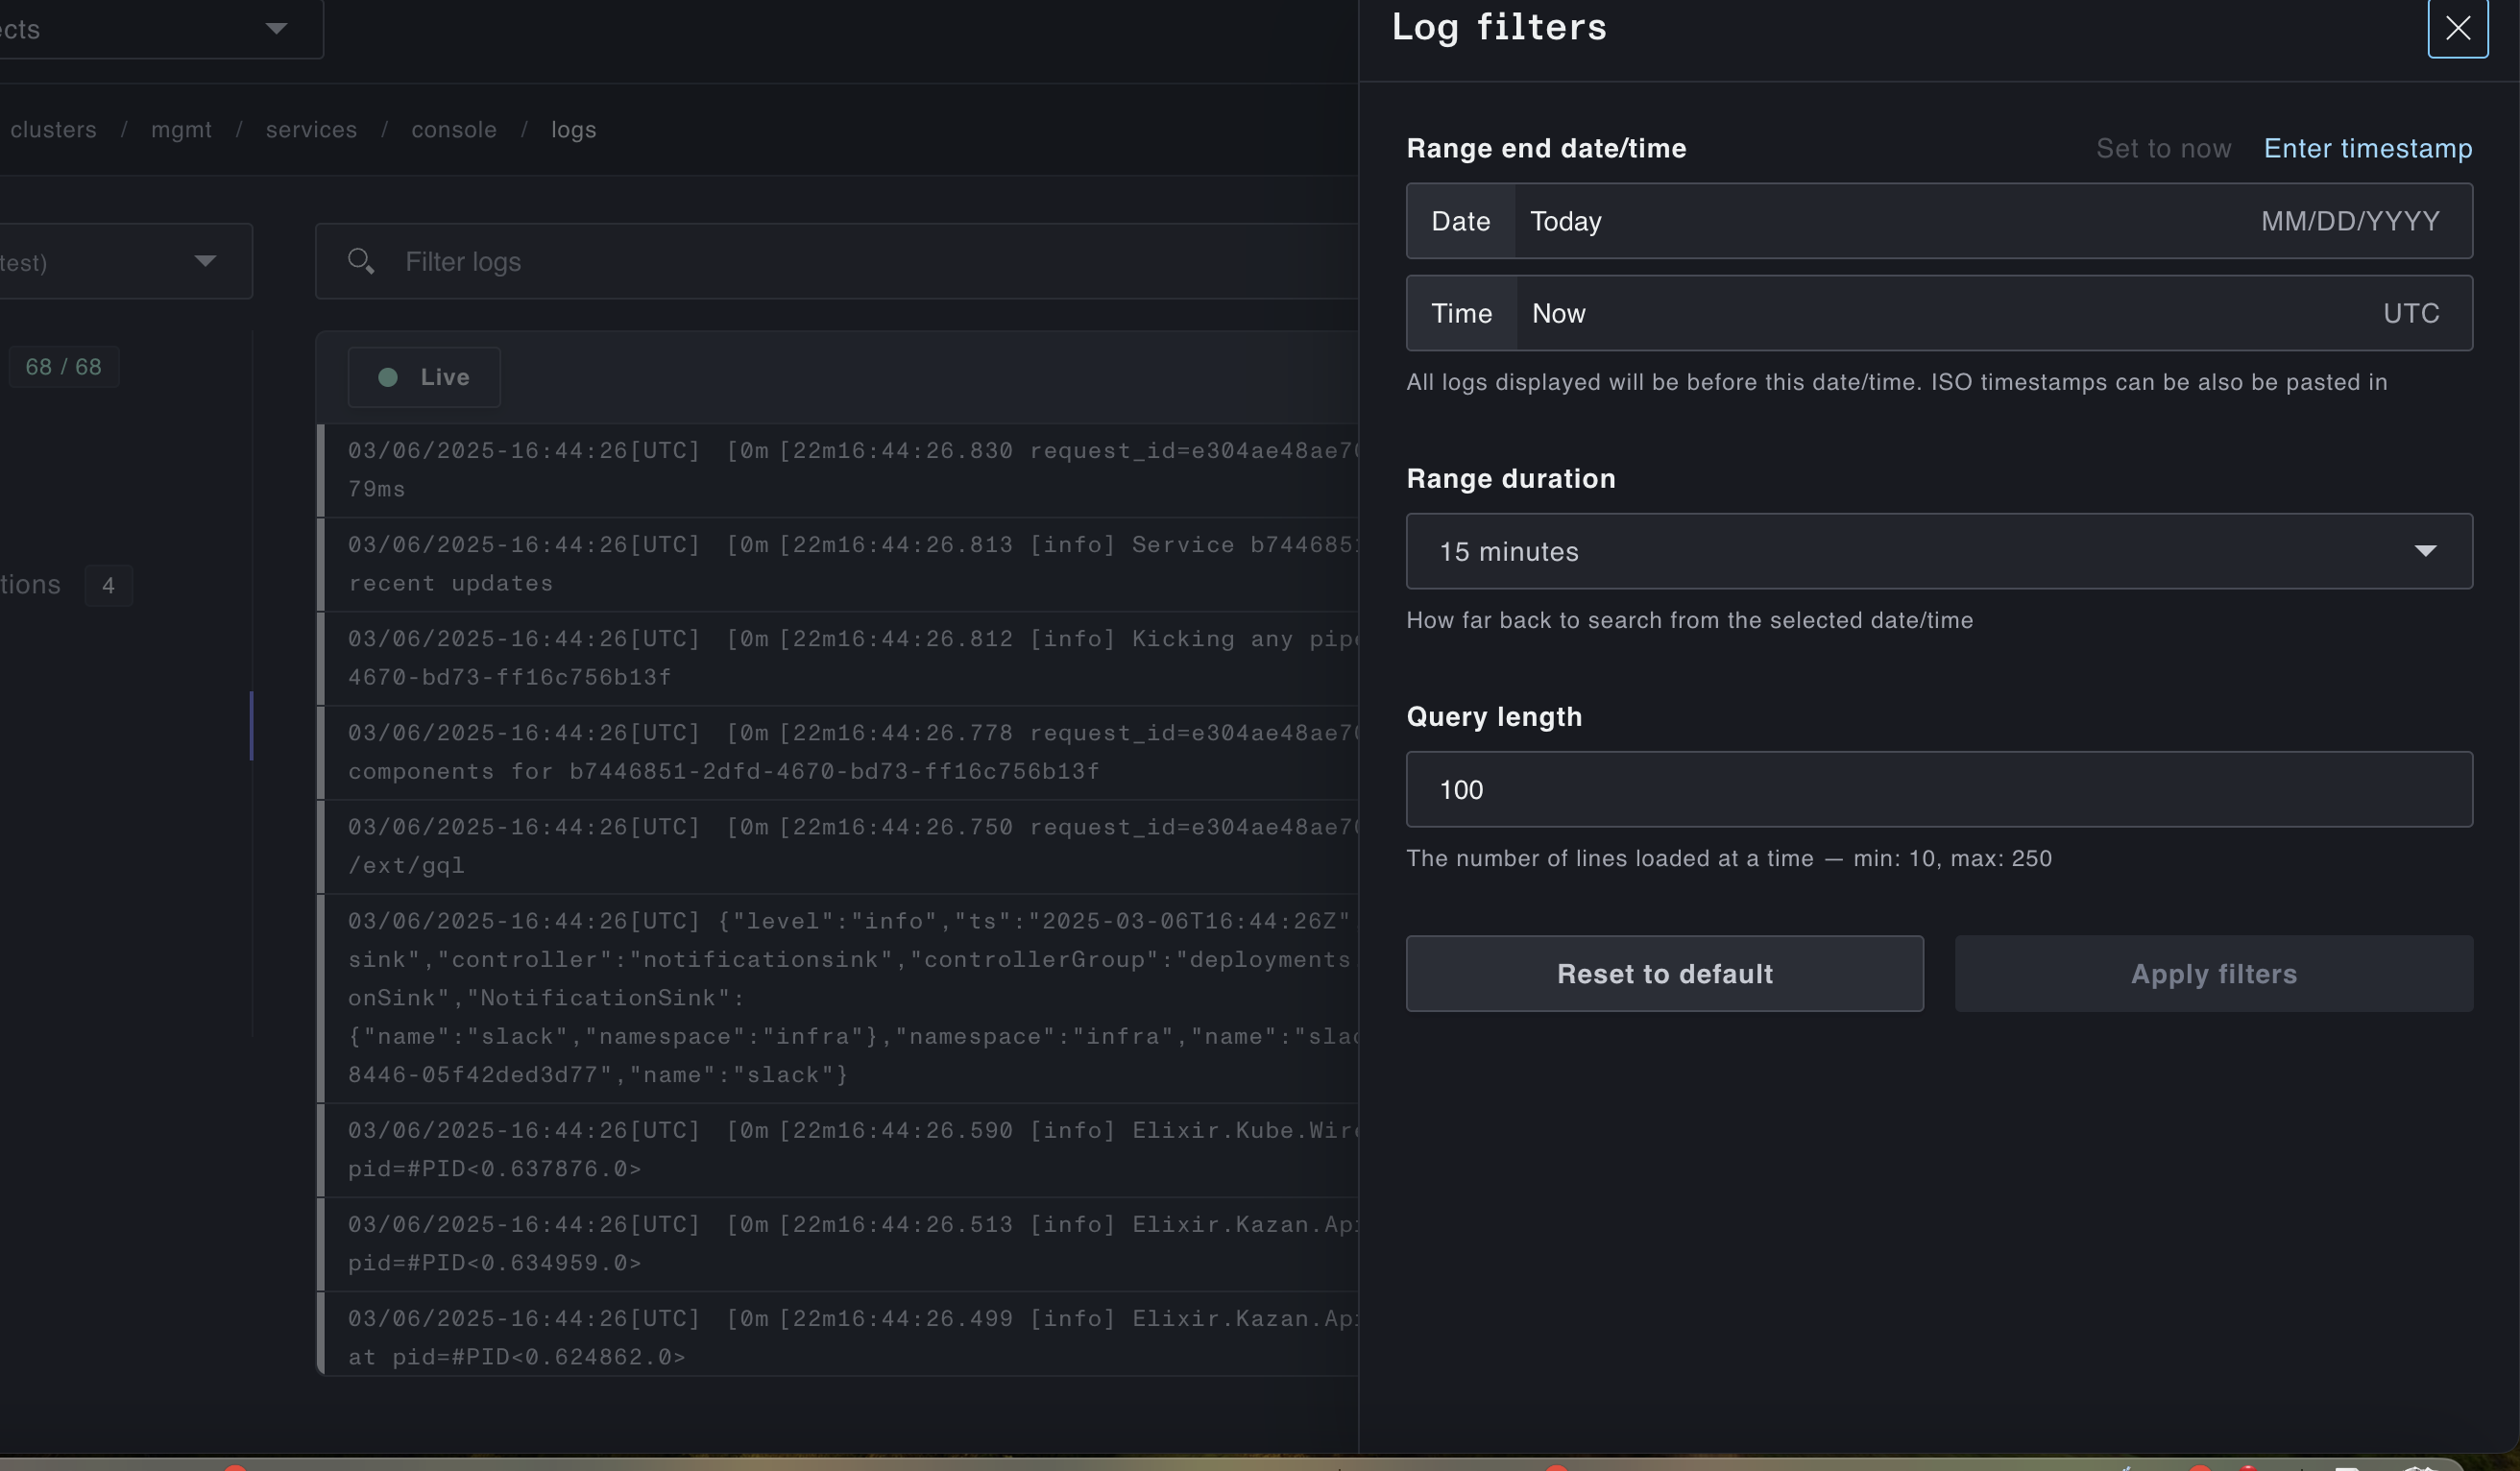
And you can tune the log view with the filter modal like: